Dashboard de InformesReports Dashboard
Rediseñé la visualización de informes comerciales del módulo CBR para que gerentes y asesores pudieran tomar decisiones sin exportar nada.I redesigned the commercial reporting views of the CBR module so managers and sales reps could make decisions without exporting anything.
El retoThe challenge
El módulo ya generaba los datos. El problema era leerlos.The module already produced the data. The problem was reading it.
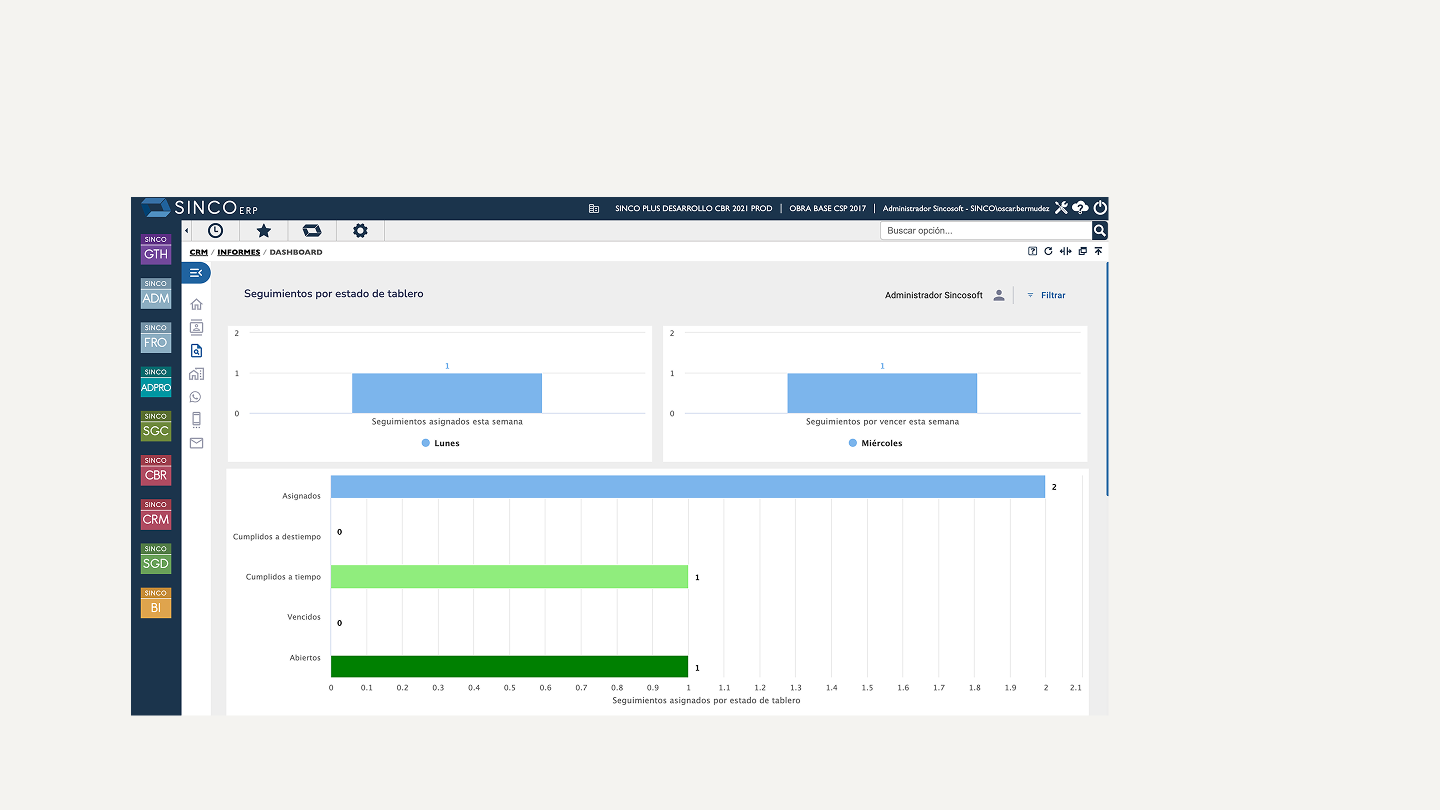
La información estaba repartida en pantallas separadas —oportunidades, seguimientos, ventas— cada una con su filtro y su propia lógica visual. Las gráficas devolvían "No data to display" con frecuencia, los embudos y las tortas se dibujaban en grises indistinguibles, y una nota en la propia interfaz advertía que la gráfica podía no verse bien con mucha información.The information was split across separate screens —opportunities, follow-ups, sales— each with its own filter and its own visual logic. Charts often returned "No data to display", funnels and pies were drawn in indistinguishable greys, and a note inside the interface warned that the chart might not render well with large queries.
Cuando el gerente necesitaba una lectura transversal, la construía él mismo cruzando pantallas.When the manager needed a cross-cutting read, he built it himself by hopping between screens.
El procesoThe process
Auditoría del estado actualAudit of the current state
Recorrí las pantallas existentes documentando qué gráfico resolvía qué pregunta y cuáles estaban rotos o vacíos. Ese inventario definió qué se conservaba, qué se fusionaba y qué se eliminaba.I walked the existing screens documenting which chart answered which question and which ones were broken or empty. That inventory defined what to keep, what to merge and what to remove.


Los dos necesitan el mismo dashboard con distinto alcance. Eso definió el filtro de asesor como control de primer nivel: la personalización por rol se resuelve filtrando, no construyendo dos productos.Both need the same dashboard with a different scope. That made the rep filter a first-level control: role personalisation is solved by filtering, not by building two products.
De la forma
a la funciónFrom form
to function
Un número bien tipografiado se lee más rápido que cualquier gráfico.A well-set number reads faster than any chart.
La barra de resumen antes que cualquier gráficoThe summary bar before any chart
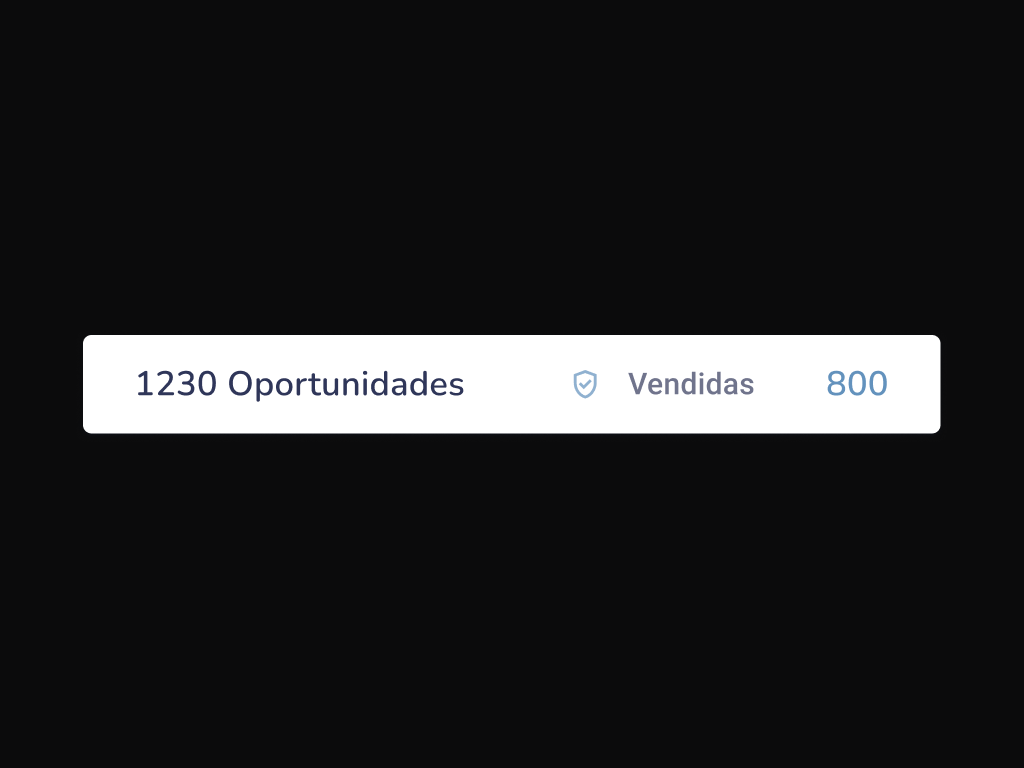
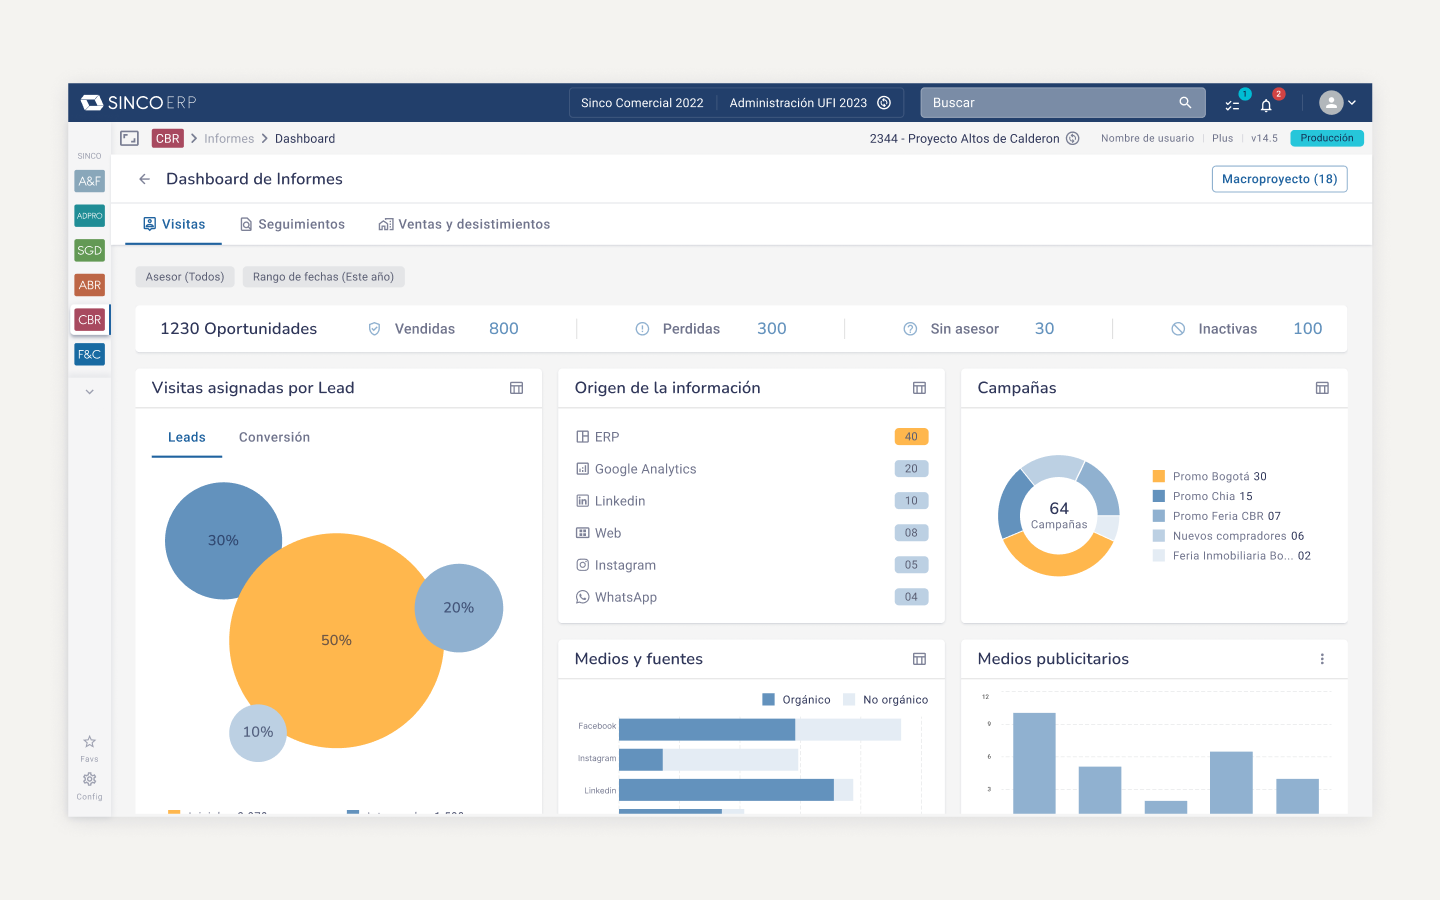
Lo primero que se lee no es una visualización sino una línea de texto grande: 1.230 oportunidades, y a su lado vendidas, perdidas, sin asesor e inactivas. Los gráficos empiezan cuando la pregunta ya no es "cuánto" sino "cómo se distribuye".The first thing you read is not a visualisation but a line of large text: 1,230 opportunities, and next to it sold, lost, unassigned and inactive. Charts begin when the question is no longer "how many" but "how is it distributed".
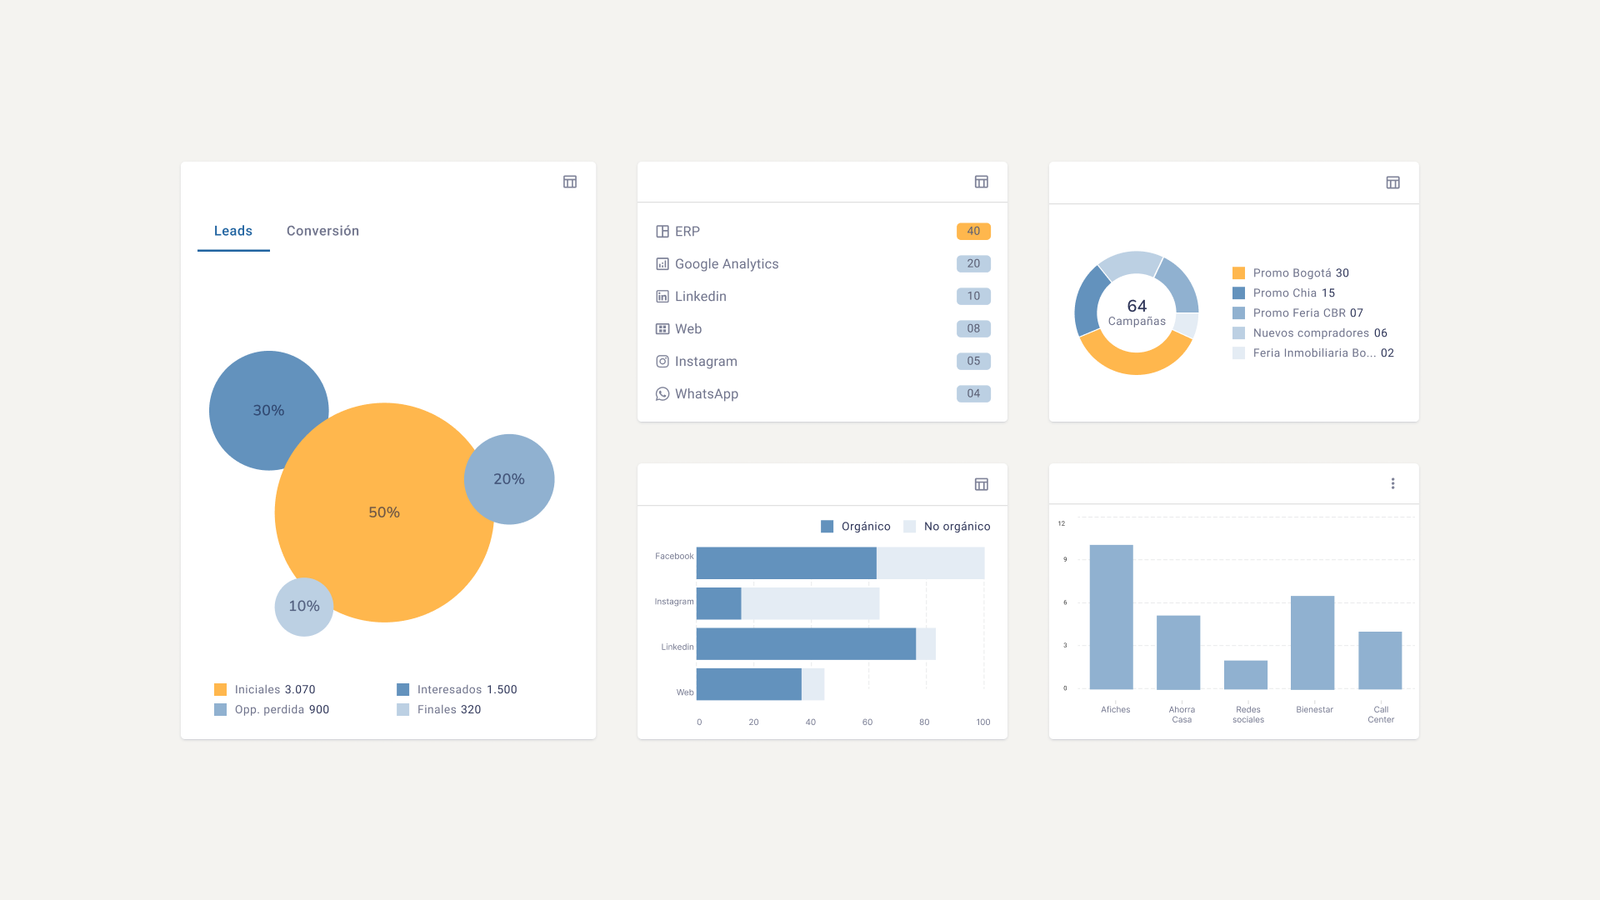
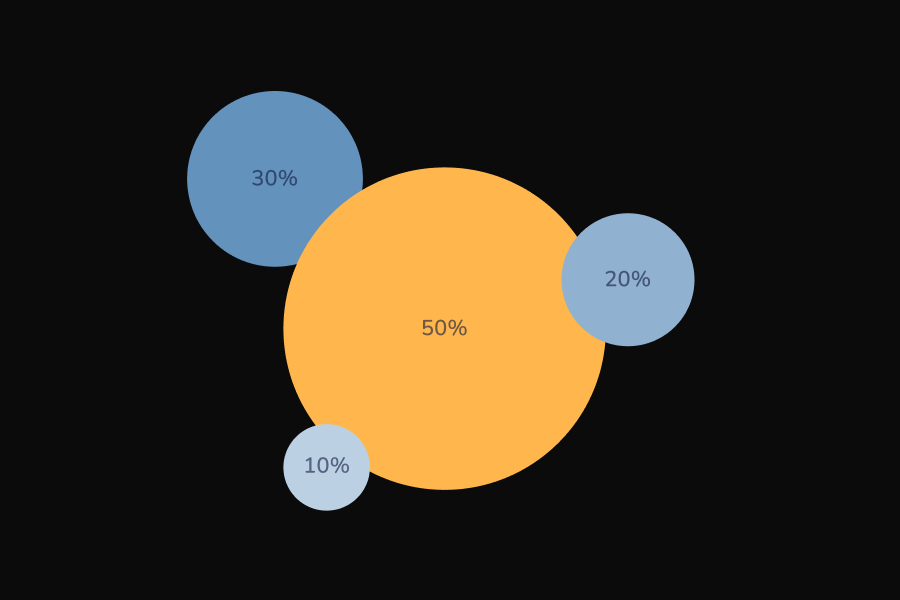
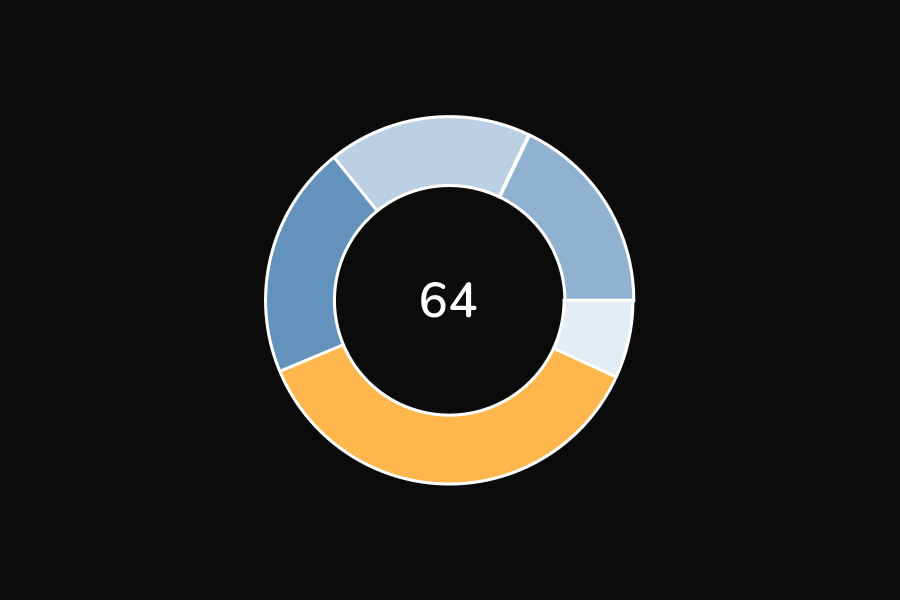
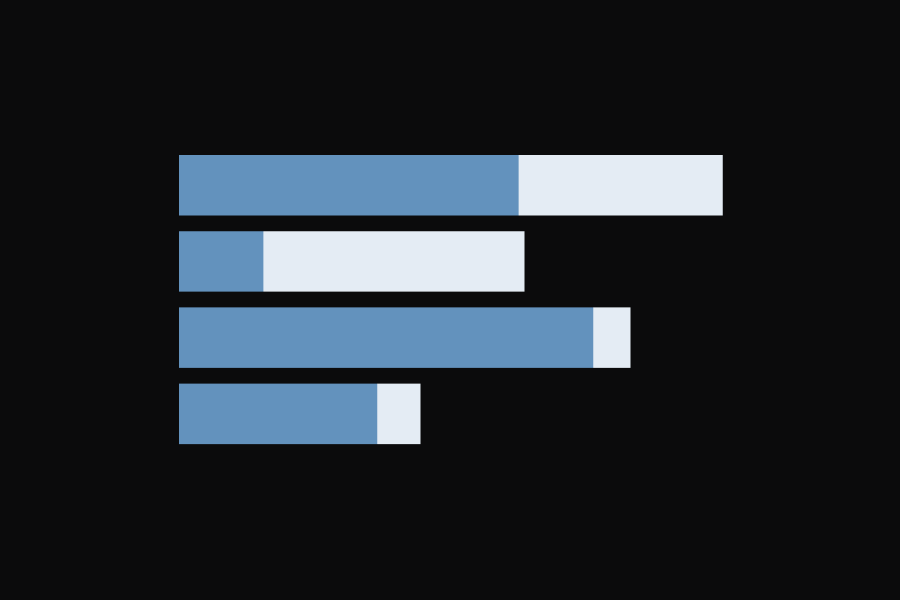
Reemplacé el embudo genérico gris por representaciones elegidas según la naturaleza del dato: burbujas proporcionales para distribución de leads, lista rankeada con badges para origen de la información, donut con total al centro para campañas, y barras apiladas para medios orgánicos vs. no orgánicos.I replaced the generic grey funnel with representations chosen by the nature of the data: proportional bubbles for lead distribution, a ranked list with badges for information source, a donut with the total at the centre for campaigns, and stacked bars for organic vs. paid media.
Cada gráfico guarda su tablaEvery chart keeps its table
Todo widget lleva un icono que abre el detalle en modal, con buscador, paginación y descarga. El gráfico responde la pregunta general, la tabla responde el caso particular; en lugar de elegir, la interfaz permite pasar de uno a otro sin salir del contexto. Es también la razón por la que el usuario deja de exportar a Excel.Every widget carries an icon that opens the detail in a modal, with search, pagination and download. The chart answers the general question, the table answers the particular case; instead of choosing, the interface lets you move between them without leaving context. It is also why the user stops exporting to Excel.

La paleta se redujo a una escala de azules con un naranja de acento; el naranja marca siempre el segmento dominante. En el diseño anterior cada gráfico tenía su propia paleta arbitraria y ninguno señalaba nada. Menos color, más significado.The palette was reduced to a blue scale with one orange accent; orange always marks the dominant segment. In the old design each chart had its own arbitrary palette and none of them pointed at anything. Less colour, more meaning.
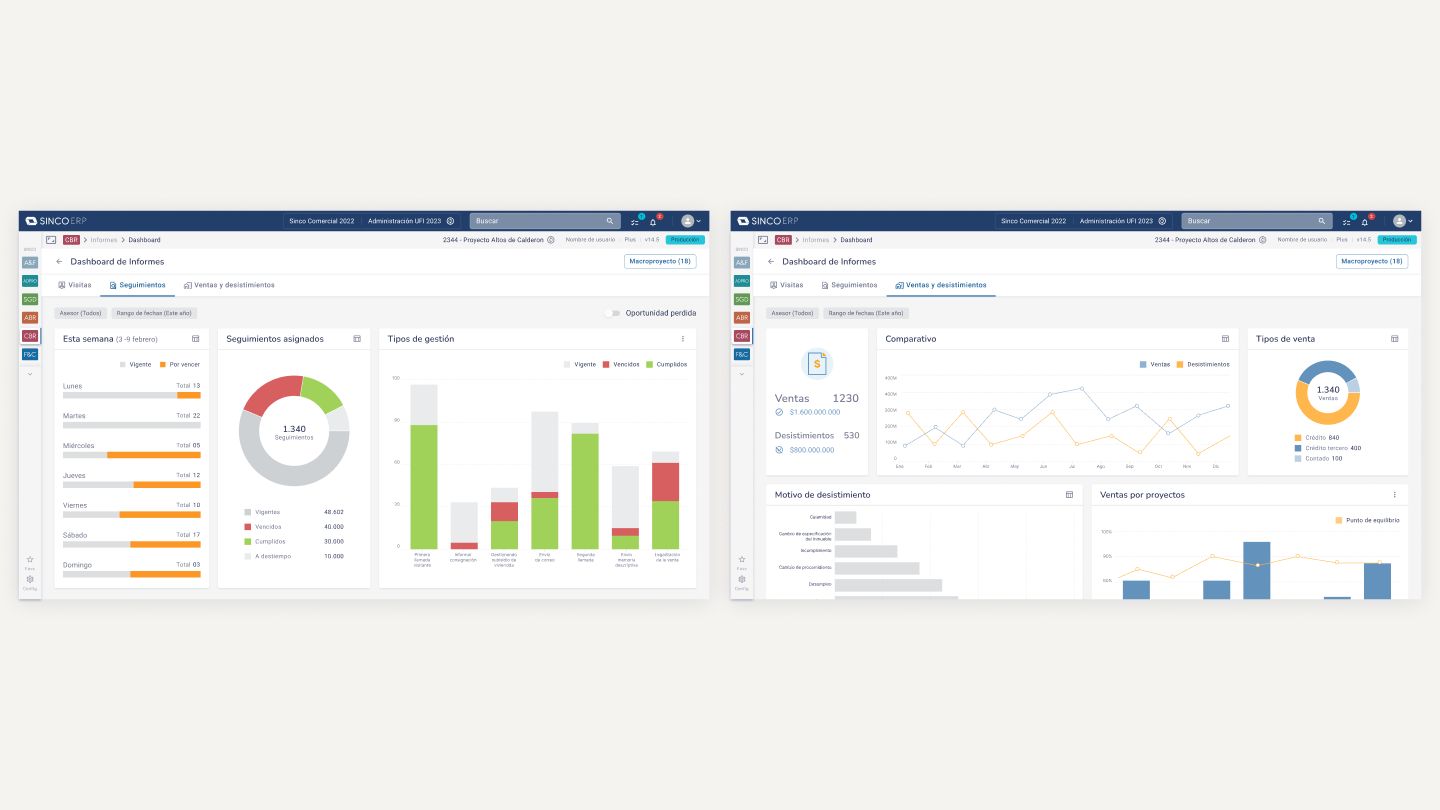
Visitas, Seguimientos y Ventas son tres preguntas distintas, no tres secciones de una pantalla larga: van en tabs. Los filtros son chips ligeros que muestran su valor activo en el propio control.Visits, Follow-ups and Sales are three distinct questions, not three sections of one long page: they live in tabs. Filters are light chips that show their active value in the control itself.
La soluciónThe solution
Una sola vista con filtros compartidos, tabs por dominio y detalle tabular en cada widget.A single view with shared filters, tabs per domain and tabular detail inside every widget.
El resultadoThe result
Tres pantallas separadas quedaron consolidadas en una sola vista con filtros compartidos.Three separate screens were consolidated into a single view with shared filters.
El mismo dashboard sirve a gerente y a asesor: el alcance se resuelve por filtro de rol en lugar de mantener vistas paralelas.The same dashboard serves manager and rep: scope is handled by a role filter instead of maintaining parallel views.
Los gráficos vacíos y las escalas ilegibles se sustituyeron por representaciones elegidas por tipo de dato, con acceso al detalle tabular en cada una.Empty charts and illegible scales were replaced by representations chosen per data type, each with access to tabular detail.
Nota de honestidad: el impacto se evaluó cualitativamente con negocio; no dispongo de métricas de adopción posteriores a la entrega.A note on honesty: impact was assessed qualitatively with the business; I have no adoption metrics after delivery.